
Vatt
Energy management for office buildings
Scroll through a day in one office tower, see where it wastes energy at night, estimate the saving for your building, and request a demo.
Next.js · React · TypeScript
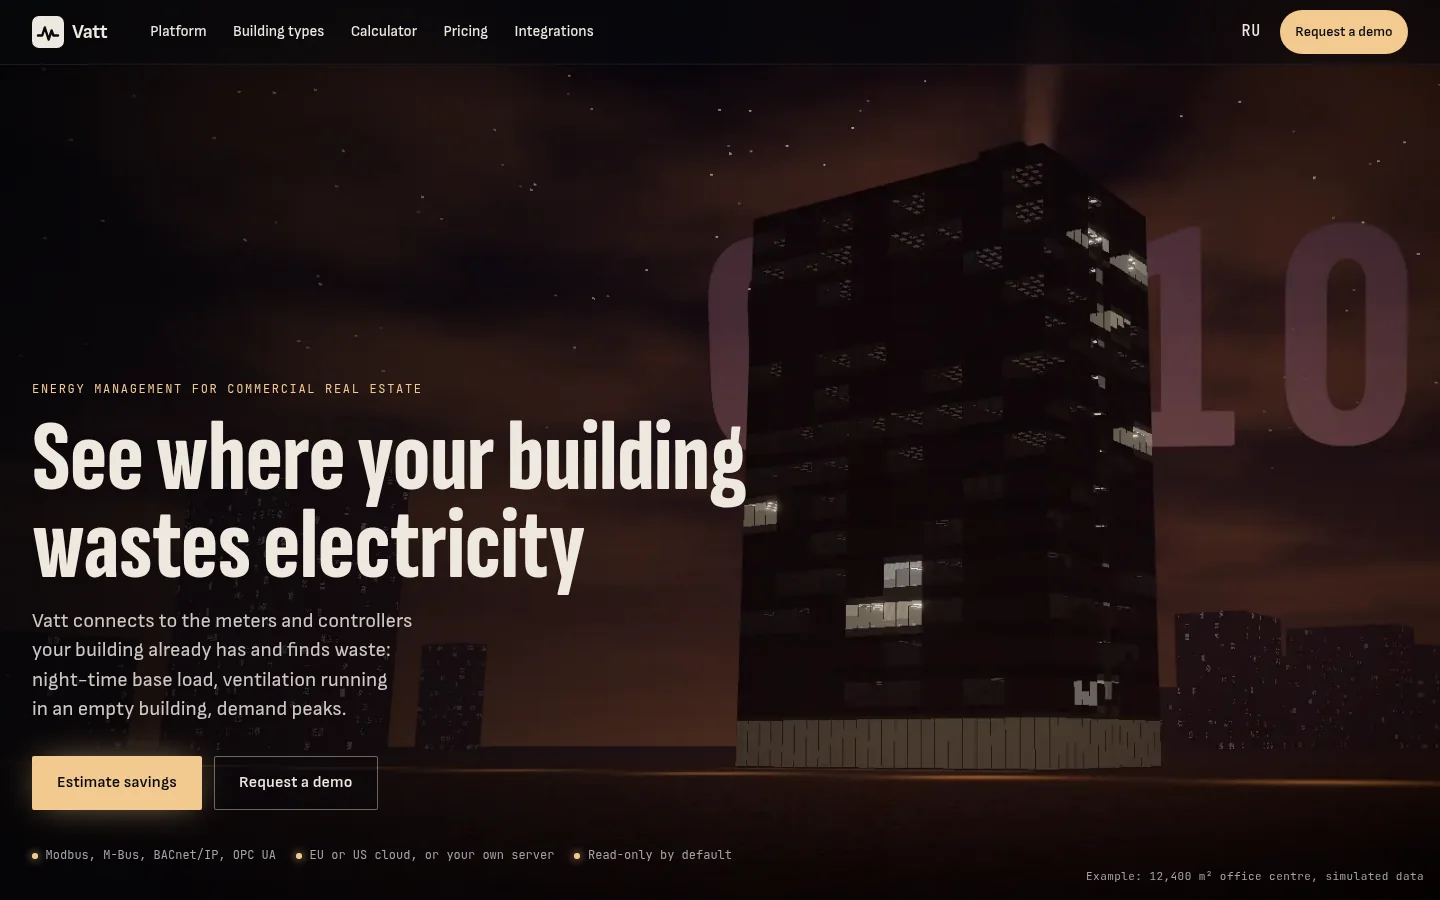
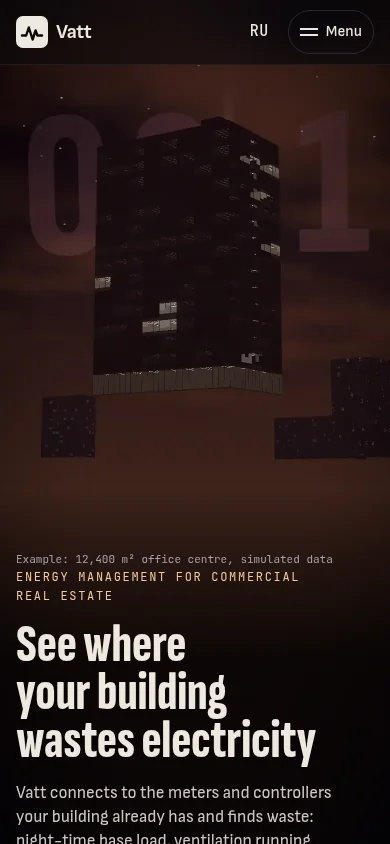
Design problem
Energy software usually opens with a dashboard the visitor has to decode. A facility manager needs to see waste in a building like theirs, understand how the platform removes it, and estimate the saving before booking a call.
Down the page
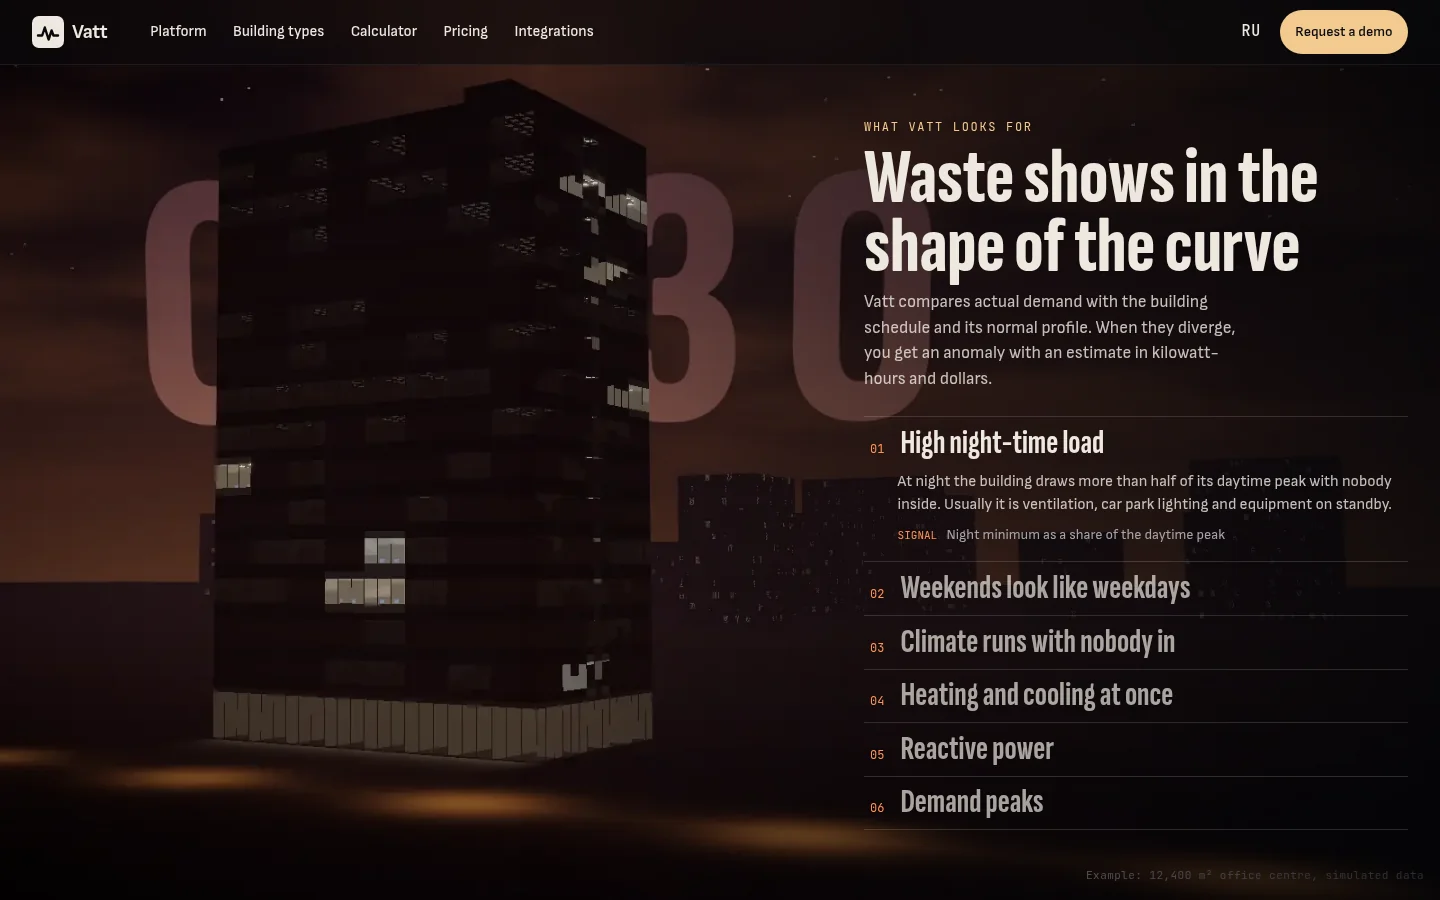
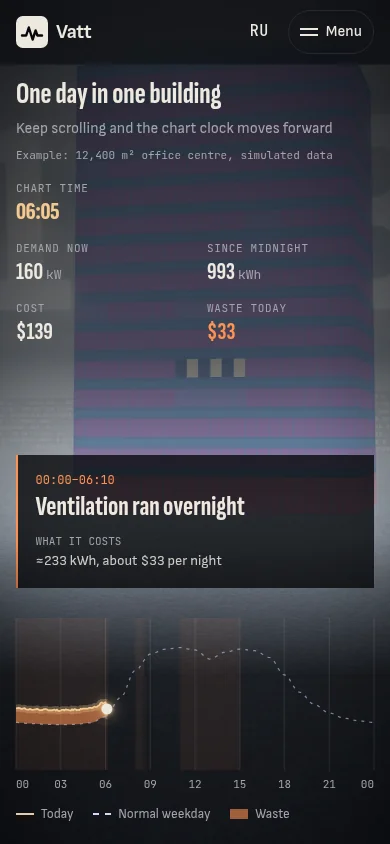
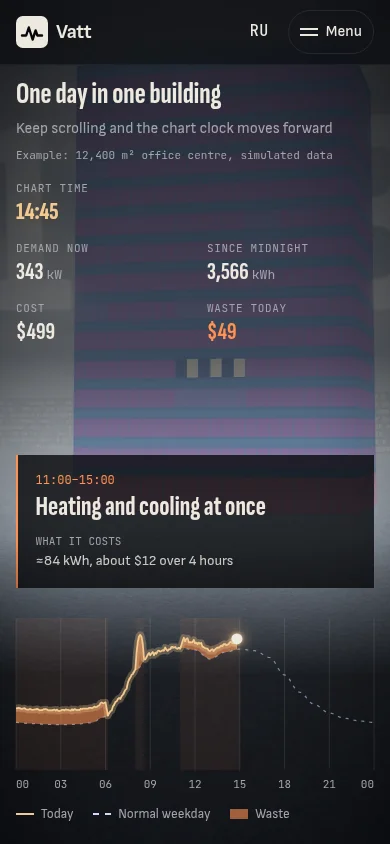
Main user flow
-
Watch a day pass
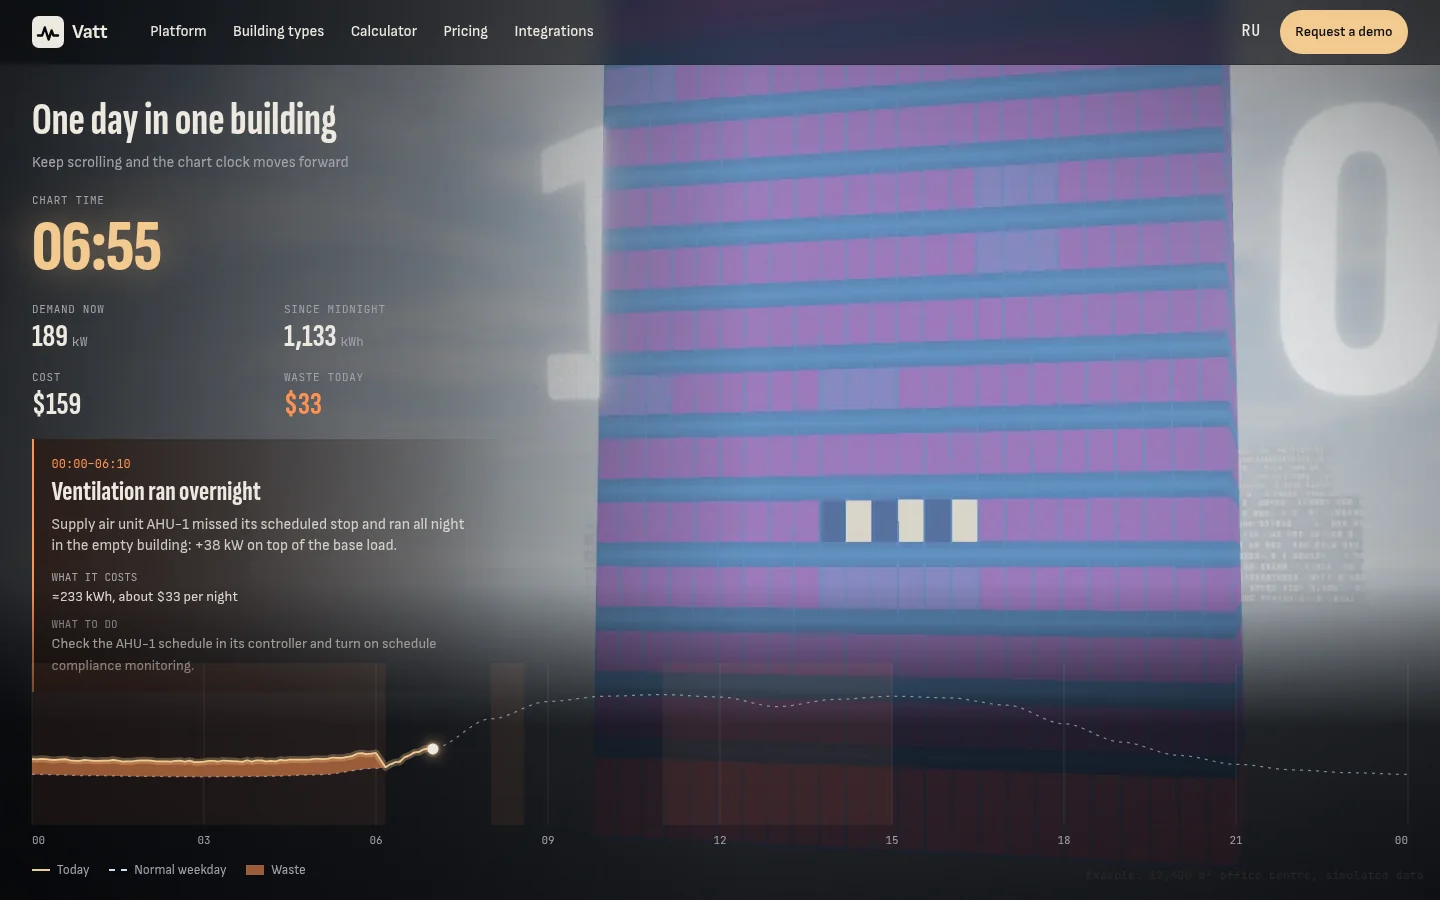
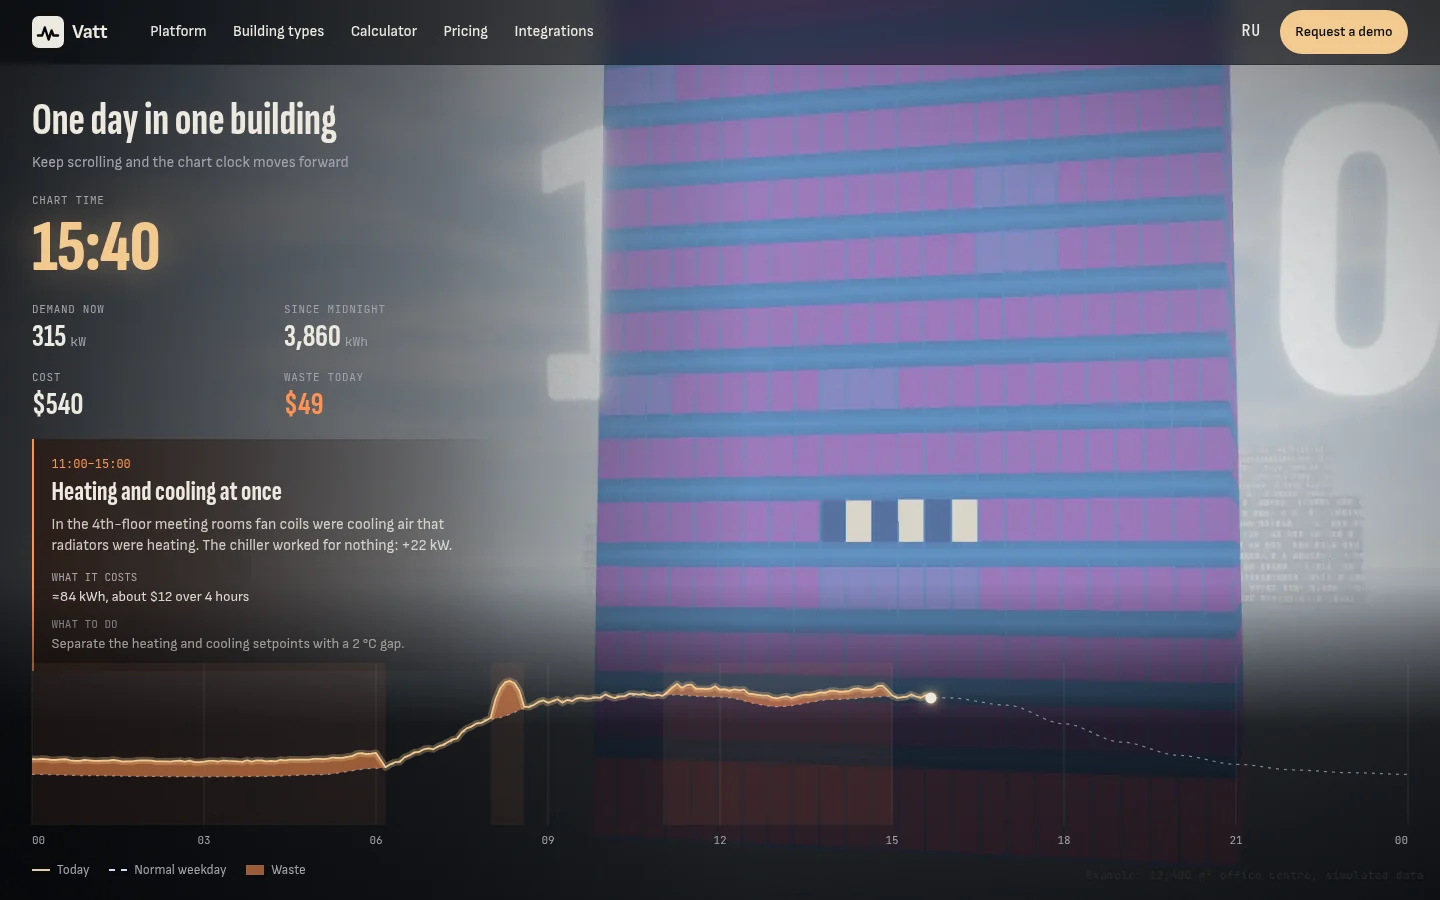
Scroll from 03:10 to 23:10: windows, sky, clock and the demand trace move together, and a thermal view shows one floor heated and cooled at once.
-
Stop the waste
At night, hold the control to apply the corrected schedule. The supply unit stops and the page shows the saving for this example building.
-
Estimate your building
Enter the building type, floor area, tariff and working hours to get a savings range and payback with visible assumptions, then request a demo.
Key decisions
-
The film illustrates, the text informs
The six scenes are server-rendered page content. The 3D building loads after the first paint and gives way to rendered stills without WebGL or with data saving on, so the story reads the same on every device.
-
One load model behind the numbers
Readouts, the demand trace, anomaly notes and the final saving come from the same simulated day of the building, so the figures on the page never contradict each other.
 Kern 75 Launch of a small batch of aluminium keyboards